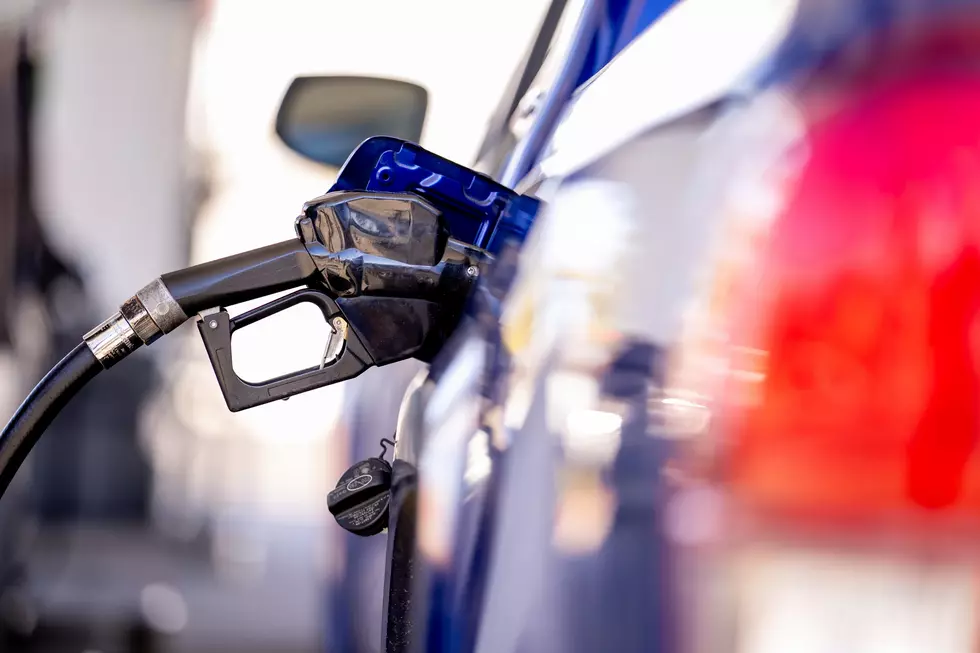

Don’t Expect Gas Prices to Fall Like Temps This Fall
If you've been searching for the cheapest gas in the Yakima Valley you'll have to take a short drive. According to GasBuddy's daily survey of 91 stations in the Valley the cheapest gas is found in Wapato.
ANOTHER WEEK ANOTHER RISE IN PRICES
Local prices are up 1.4 cents per gallon in the past week, averaging $3.69 per gallon today. Prices in Yakima are 5.9 cents per gallon lower than a month ago and stand 99.5 cents per gallon higher than a year ago.
According to GasBuddy price reports, the cheapest station in Wapato is priced at $3.05 per gallon today while the most expensive is $3.99 per gallon, a difference of 94.0 cents per gallon.
THE NATIONAL PRICE IS UNCHANGED FROM LAST WEEK
The lowest price in the state today is $3.17 per gallon while the highest is $4.26 per gallon, a difference of $1.09 per gallon.
No change in the national prices of gasoline averaging $3.18 per gallon today. The national average is unchanged from a month ago and stands $1.01 per gallon higher than a year ago.
"We've seen very little overall movement in gas prices over the last week with prices remaining near their 2021 highs as crude oil prices remain well above $70 on supply concerns and strong global demand," said Patrick De Haan, head of petroleum analysis for GasBuddy. "With energy in high demand ahead of the winter heating season and a surge in global demand due to COVID-induced imbalances, we're not likely to see a meaningful decline at the pump any time soon, but unfortunately, could see prices holding near these levels for the next few weeks."
LOOKING BACK OVER THE PAST 10 YEARS
Historical gasoline prices in Yakima and the national average going back ten years:
October 4, 2020: $2.69/g (U.S. Average: $2.17/g)
October 4, 2019: $3.15/g (U.S. Average: $2.67/g)
October 4, 2018: $3.38/g (U.S. Average: $2.91/g)
October 4, 2017: $2.91/g (U.S. Average: $2.51/g)
October 4, 2016: $2.69/g (U.S. Average: $2.23/g)
October 4, 2015: $2.53/g (U.S. Average: $2.29/g)
October 4, 2014: $3.59/g (U.S. Average: $3.30/g)
October 4, 2013: $3.64/g (U.S. Average: $3.35/g)
October 4, 2012: $4.00/g (U.S. Average: $3.78/g)
October 4, 2011: $3.83/g (U.S. Average: $3.40/g)
LOOK: The most expensive weather and climate disasters in recent decades
Gallery Credit: KATELYN LEBOFF
More From News Talk KIT