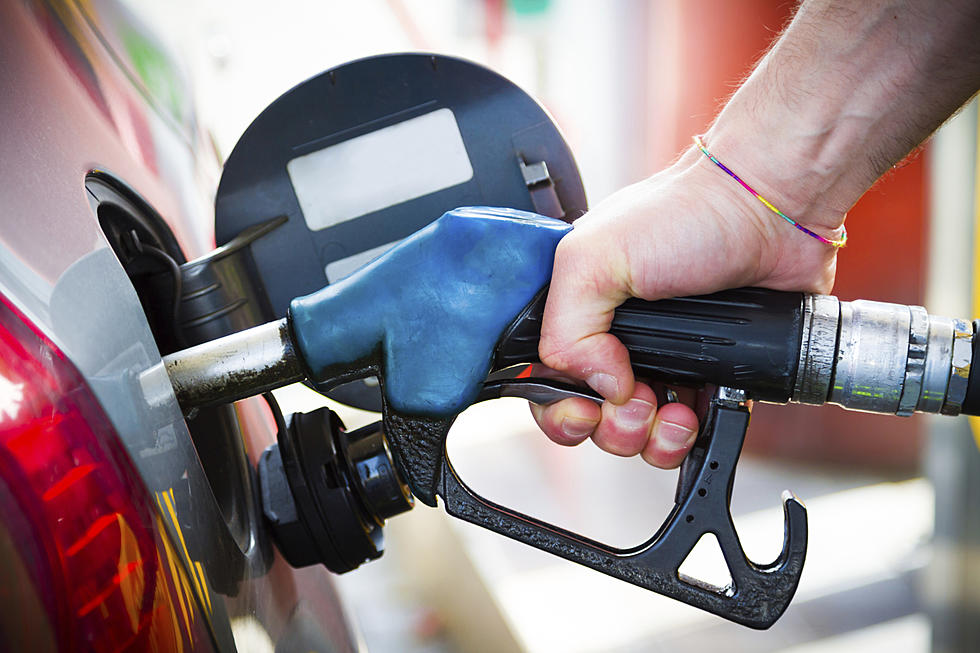
Another Price Drop But Yakima Drivers Still Feel The Pain
The price is down but it's still expensive. Gas. it's something most of us need and this week the price is averaging $4.58 per gallon, according to GasBuddy's survey of 91 stations in Yakima. Prices in Yakima are 44.3 cents per gallon higher than a month ago and stand $1.38 per gallon higher than a year ago. Looking for the cheapest gas? GasBuddy says it's in Wapato at the Wolfden priced at $3.98 per gallon.
Even the national price of gas is down but still expensive
The lowest price in the state yesterday was $3.89 per gallon while the highest was $6.00per gallon, a difference of $2.11.
On the national side the price of gasoline has fallen 5.4 cents per gallon in the last week, averaging $4.17 per gallon today. The national average is up 25.5 cents per gallon from a month ago and stands $1.31 per gallon higher than a year ago according to GasBuddy data compiled from more than 11 million weekly price reports covering over 150,000 gas stations across the country.
As long as things stay stable we can continue to see decreases
“Oil prices fell last week as Covid cases in China surged, prompting restrictions on movements and hurting oil demand. Meanwhile, President Biden's announcement that the U.S. would be releasing 180 million barrels from the Strategic Petroleum Reserve caused an even further decline in oil, leading gas prices in nearly all areas of the country to fall over the last week," says Patrick De Haan, head of petroleum analysis at GasBuddy. "So long as oil prices remain under $100 per barrel and there's no escalations in Russia's war on Ukraine, we may be poised to see gas prices decline again this week as the U.S. and other countries try to raise oil supply to tip prices lower."
Drivers were paying a lot less in April of 2020
Historical gasoline prices in Yakima and the national average going back ten years:
April 4, 2021: $3.19/g (U.S. Average: $2.86/g)
April 4, 2020: $2.68/g (U.S. Average: $1.90/g)
April 4, 2019: $3.07/g (U.S. Average: $2.73/g)
April 4, 2018: $3.01/g (U.S. Average: $2.66/g)
April 4, 2017: $2.83/g (U.S. Average: $2.35/g)
April 4, 2016: $2.24/g (U.S. Average: $2.06/g)
April 4, 2015: $2.54/g (U.S. Average: $2.39/g)
April 4, 2014: $3.62/g (U.S. Average: $3.57/g)
April 4, 2013: $3.61/g (U.S. Average: $3.63/g)
April 4, 2012: $4.06/g (U.S. Average: $3.93/g)
LOOK: See how much gasoline cost the year you started driving
LOOK: Here are the 10 US golf destinations with the most courses per capita
LOOK: Stunning vintage photos capture the beauty of America's national parks
More From News Talk KIT


