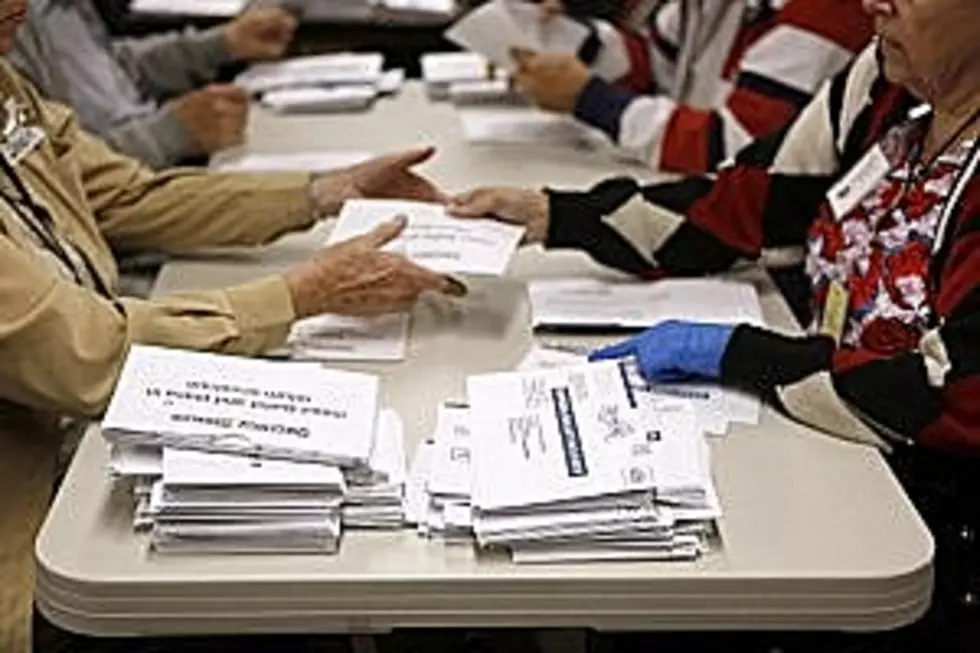

Low Ballot Return For Primary with Little Interest From Voters
Each day the Yakima County Auditor provides updated numbers as to how many ballots have been returned. Currently of the nearly 89,000 ballots that were sent out, 7,468 have been returned or 8.37%
VOTERS ARE RETURNING BALLOTS IN CITY COUNCIL DISTRICTS 2,4 AND 6
In the city of Yakima, people are choosing candidates in Yakima City Council Districts 2, 4 and 6. So far in District 2 162 ballots have been returned, in District 4, 435 ballots have been voted and 1,589 ballots have been voted and returned in District 6.
August 3 is the primary election in which the top two winners advance to the general election.
NOT ALL REGISTERED VOTERS HAVE A BALLOT TO VOTE
Yakima County Auditor Charles Ross says not all voters received a ballot in the primary election, only those voters who live in a district with more than two candidates running for a position have a ballot to vote.
Along with the city council races in Yakima, a seat in District 3 on the Board of Yakima County Commissioners is up for grabs and 2 seats are open on the Yakima School District Board of Directors.
Ross expects a 25 to 28% turnout for the election.
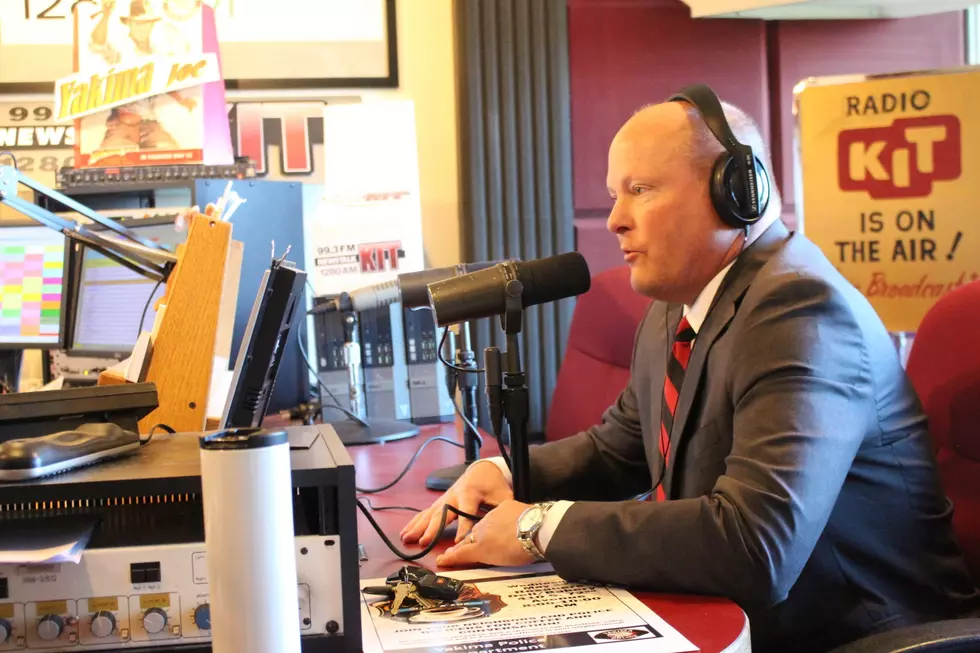
KIT CANDIDATE INTERVIEWS START ON TUESDAY
KIT candidate interviews start on Tuesday, July 27. We will be talking to Yakima City Council candidates in District 2, 4 and 6. We'll also be talking with candidates in District 3 race on the Yakima County Commission.
The interviews begin at 7:00AM.
Here's the schedule.
Tuesday, July 27
District 2
7:00-7:30AM Danny Herrera
7:30-8:00AM Edgar Hernandez
8:00-8:30AM Raul Martinez
8:30-9:00AM Christina Martinez
Wednesday, July 28
District 4
7:00-7:30AM Janice Deccio
7:30-8:00AM Mark Shervey
Thursday, July 29
District 6
7:30-8:00AM Sam Johnson
8:00-8:30AM Lisa Wallace
8:30-9:00AM Matt Brown
Friday, July 30
Yakima County Commission
District 3
8:00-8:30AM Autumn Torres
8:30-9:00AM LaDon Linde
How Many in America: From Guns to Ghost Towns
READ ON: See the States Where People Live the Longest
LOOK: The Most Famous Actor Born Every Year
More From News Talk KIT