Like The Temps Gas on The Rise in Washington State
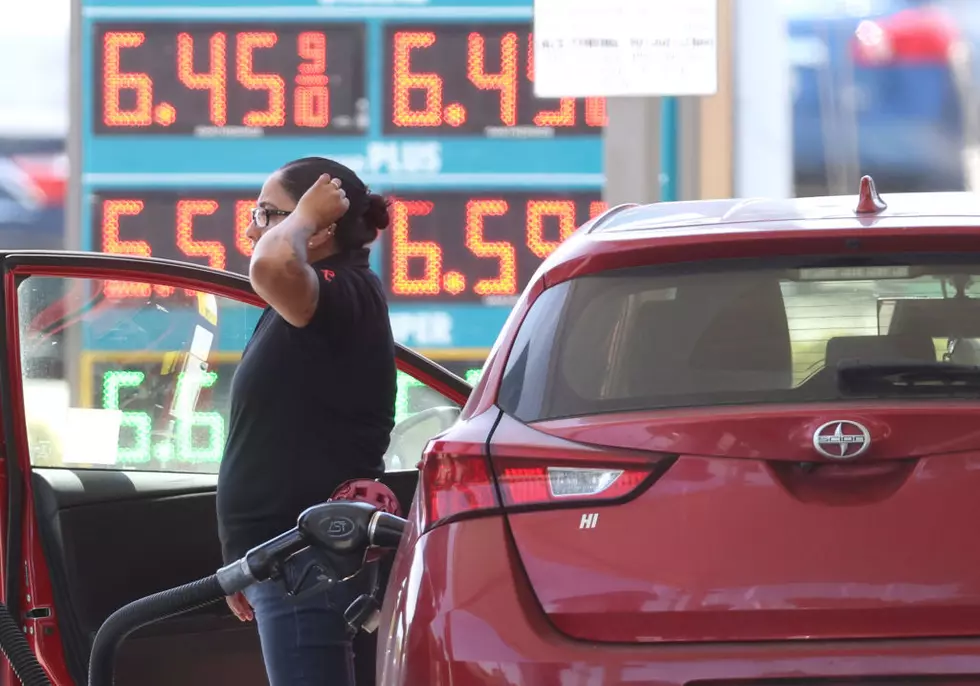
The cost of gas is on the rise like the temperatures in the state with the average cost of a gallon of regular unleaded is $4.59 a gallon up from $4.58 on Friday.
IF YOU PUMP GAS IN YAKIMA YOU'LL PUMP CHEAPER THAN THE STATE AVERAGE
But if you fill the tank in Yakima you'll find a cheaper price. Average prices in Yakima are up 2.3 cents per gallon in the last week, averaging $4.29 per gallon today, according to GasBuddy's survey of 91 stations in Yakima.
Prices in Yakima are 28.4 cents per gallon higher than a month ago and stand 26.6 cents per gallon lower than a year ago.
The national average price of diesel has fallen 5.3 cents in the last week and stands at $4.07 per gallon.
WAPATO HAS THE CHEAPEST GAS IN THE VALLEY
According to GasBuddy price reports, the cheapest station in the valley was priced at $3.68 per gallon Sunday.
The lowest price in the state yesterday was $3.57 per gallon while the highest was $5.29 per gallon.
GOOD NEWS FOR DIESEL PRICES
"After declining the prior week at a slow pace, the drop in the national average has gained momentum. Oil prices have come under additional selling pressure alongside wholesale gasoline prices, giving retailers room to pass on the lower prices," said Patrick De Haan, head of petroleum analysis at GasBuddy. "Diesel prices have followed, falling to their lowest in over 13 months as demand remains weak due to concerns over the economy. With refinery maintenance wrapping up, we should see supplies start to build in the weeks ahead, just in time for the summer driving season, potentially putting more downward pressure on prices. However, while a majority of states saw gas prices drop, some, particularly in the Northeast, have yet to join in thanks to being the last to make the switch to summer gasoline - but relief will be on the way soon in areas that have resisted the fall thus far."
REMEMBER WHEN?
Historical gasoline prices in Yakima and the national average going back ten years:
May 1, 2022: $4.55/g (U.S. Average: $4.17/g)
May 1, 2021: $3.34/g (U.S. Average: $2.89/g)
May 1, 2020: $2.20/g (U.S. Average: $1.77/g)
May 1, 2019: $3.40/g (U.S. Average: $2.89/g)
May 1, 2018: $3.13/g (U.S. Average: $2.81/g)
May 1, 2017: $2.88/g (U.S. Average: $2.37/g)
May 1, 2016: $2.32/g (U.S. Average: $2.22/g)
May 1, 2015: $2.69/g (U.S. Average: $2.60/g)
May 1, 2014: $3.81/g (U.S. Average: $3.69/g)
May 1, 2013: $3.56/g (U.S. Average: $3.53/g)
Neighboring areas and their current gas prices:
Tacoma- $4.54/g, unchanged from last week's $4.53/g.
Seattle- $4.69/g, up 2.6 cents per gallon from last week's $4.66/g.
Washington- $4.53/g, up 1.8 cents per gallon from last week's $4.52/g.
LOOK: See the iconic cars that debuted the year you were born
LOOK: See how much gasoline cost the year you started driving
More From News Talk KIT


